Table of contents
How to Setup Prometheus in AWS EC2 Ubuntu Machine:
Login to AWS Console:
Go to the AWS Management Console (https://aws.amazon.com/).
Sign in with your AWS account.
Navigate to EC2:
In the AWS Management Console, navigate to the EC2 service.
Launch an Instance:
Click on the "Instances" in the left navigation pane.
Click the "Launch Instances" button.
Choose an Amazon Machine Image (AMI):
In the "Step 1: Choose an Amazon Machine Image (AMI)" section, select an Ubuntu AMI. You can search for "Ubuntu" in the search bar and choose an appropriate version (e.g., Ubuntu Server 20.04 LTS).
Choose an Instance Type:
In the "Step 2: Choose an Instance Type" section, select "t2.xlarge" as the instance type.
Click "Next: Configure Instance Details."
Configure Instance Details:
In the "Step 3: Configure Instance Details" section:
Set the "Number of instances" to 1.
Optionally, you can configure additional settings, such as network, subnet, IAM role, etc.
Click "Next: Add Storage."
Add Storage:
In the "Step 4: Add Storage" section, you can leave the default storage settings or adjust as needed.
Click "Next: Add Tags."
Add Tags:
In the "Step 5: Add Tags" section, click "Add Tag."
For "Key," enter "Name" and for "Value," enter "Jenkins" (or your preferred name).
Click "Next: Configure Security Group."
Configure Security Group:
In the "Step 6: Configure Security Group" section:
Create a new security group or use an existing one.
Add inbound rules to allow HTTP (port 80), HTTPS (port 443), and SSH (port 22) traffic.
Click "Review and Launch."
Review and Launch:
Review your configuration settings.
Click "Launch."
Select Key Pair:
In the key pair dialog, select "Choose an existing key pair" and choose the "Prometheus" key pair.
Acknowledge that you have access to the private key.
Click "Launch Instances."
View Instances:
Once the instance is launched, you can view it in the EC2 dashboard.
Wait for the instance to reach the "running" state.

Setup Prometheus in Ubuntu:
Go to Ubuntu Machine and update the ubuntu machine:
sudo apt-get update
So If we need to install Prometheus, So Need to create a Docker Container, So First we need to install docker.
sudo apt-get install docker.io
sudo usermod -aG docker $USER
sudo reboot
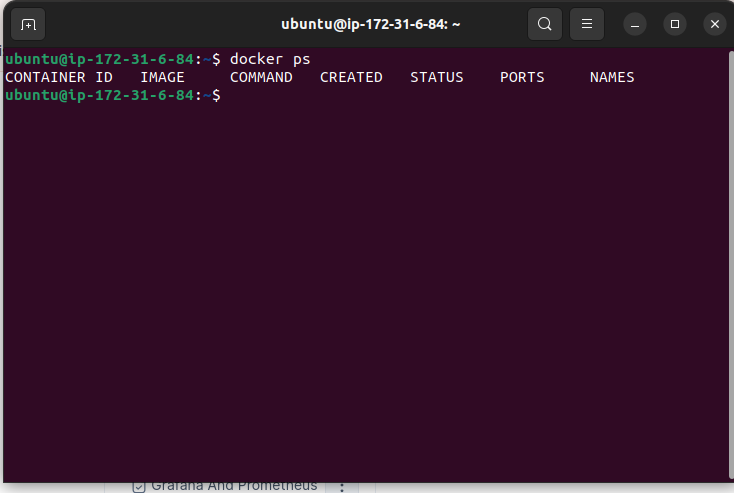
Again login your Ubuntu and type docker command.
docker ps

Now need to install docker compose.
sudo apt-get install \
  apt-transport-https \
  ca-certificates \
  curl \
  software-properties-common
curl -fsSL https://download.docker.com/linux/ubuntu/gpg | sudo gpg --dearmor -o /usr/share/keyrings/docker-archive-keyring.gpg
sudo apt-get update
sudo apt-get install docker-ce docker-ce-cli containerd.io
sudo curl -L "https://github.com/docker/compose/releases/download/v2.6.1/docker-compose-$(uname -s)-$(uname -m)" -o /usr/local/bin/docker-compose
sudo chmod +x /usr/local/bin/docker-compose
docker --version
docker-compose --version
sudo reboot
Again login your Ubuntu and type docker command.
docker ps

Now we need to create a one directory that is prometheus.

So First we need to Download Prometheus Configration File
wget https://raw.githubusercontent.com/prometheus/prometheus/main/documentation/examples/prometheus.yml
For this link we can download Prometheus Configration file, so copy this command and paste your Ubuntu Machine.

Now need to create a docker-compse file for the Prometheus.
version: '3.2'
services:
  prometheus:
    image: prom/prometheus:latest
    container_name: prometheus
    ports:
      - 9090:9090
    command:
      - --config.file=/etc/prometheus/prometheus.yml
    volumes:
      - ./prometheus.yml:/etc/prometheus/prometheus.yml:ro
    depends_on:
      - cadvisor
  cadvisor:
    image: gcr.io/cadvisor/cadvisor:latest
    container_name: cadvisor
    ports:
      - 8080:8080
    volumes:
      - /:/rootfs:ro
      - /var/run:/var/run:rw
      - /sys:/sys:ro
      - /var/lib/docker/:/var/lib/docker:ro
    depends_on:
      - redis
  redis:
    image: redis:latest
    container_name: redis
    ports:
      - 6379:6379
This docker-compose file we have service , cadvisor and redis. So let me explain cadvisor, we use cadvisor because Prometheus working for metrics and alerting but it is also working for time series data base, so if we need to send container metrics to Prometheus , so there has been some tool that is cadivsor send the metrics. So cadivsor work for containers API call and send the Prometheus.

No go to Ubuntu Machine and create a docker-compose file and run this file.


save this file for press esc button and type :wq and enter. After that run this file.
docker-compose up -d

Now need to type docker command.
docker ps

you can see we have cadvisor and Prometheus. Cadvisor running to port number 8080 and Prometheus running to port number 9090.
No go the ec2 Instance, go to the security group and change the security group and the port number 8080 and 9090.


Now we will go to check the metrics for the project go to the docker hub and pull the any image we will use node app image.
docker pull ishusharmaece/node-app-batch-6:latest

Now This project is running for port number 8000.
docker run -d -p 8000:8000 --name NodeApp ishusharmaece/node-app-batch-6:latest
Now check container is running port 8000.

The name of container is Node App. Now go the Ec2 Instance, go the the security group and add the 8000 port number and copy to public ip paste to another browser including 8000 port number.

Now application is running, Now go the cadvisor and check we have Node App container is here or not.

Now we have Node App here in Cadvisor. Now we have application in Cadvisor need to go to Prometheus so change the Prometheus config file.
Prometheus Config File
# my global config
global:
  scrape_interval: 15s # Set the scrape interval to every 15 seconds. Default is every 1 minute.
  evaluation_interval: 15s # Evaluate rules every 15 seconds. The default is every 1 minute.
  # scrape_timeout is set to the global default (10s).

# Alertmanager configuration
alerting:
  alertmanagers:
    - static_configs:
        - targets:
          # - alertmanager:9093

# Load rules once and periodically evaluate them according to the global 'evaluation_interval'.
rule_files:
  # - "first_rules.yml"
  # - "second_rules.yml"

# A scrape configuration containing exactly one endpoint to scrape:
# Here it's Prometheus itself.
scrape_configs:
  # The job name is added as a label `job=<job_name>` to any timeseries scraped from this config.
  - job_name: "prometheus"

    # metrics_path defaults to '/metrics'
    # scheme defaults to 'http'.

    static_configs:
      - targets: ["localhost:9090"]
  - job_name: "docker"
    static_configs:
      - targets: ["cadvisor:8080"]
Now need to restart your prometheus container.


Now go the prometheus server and refresh it.

Now we have docker logs in Prometheus .Now we check matrics for Node App Aplication.
